Download Tableau Desktop Specialist.TDS-C01.VCEplus.2024-12-09.143q.vcex
| Vendor: | Tableau |
| Exam Code: | TDS-C01 |
| Exam Name: | Tableau Desktop Specialist |
| Date: | Dec 09, 2024 |
| File Size: | 22 MB |
How to open VCEX files?
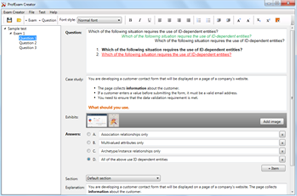
Files with VCEX extension can be opened by ProfExam Simulator.
Discount: 20%
Demo Questions
Question 1
How does Tableau know at which level to aggregate values?
- Values are always aggregated at the level of granularity of the worksheet.
- Tableau doesn't aggregate values, we do!
- Values are always aggregated at the level of the Date Part
- Aggregation is always done by using Tableau special formulas
Correct answer: A
Explanation:
In Tableau, you can aggregate measures or dimensions, though it is more common to aggregate measures. Whenever you add a measure to your view, an aggregation is applied to that measure by default. The type of aggregation applied varies depending on the context of the view.When you add a measure to the view, Tableau automatically aggregates its values. Sum, average, and median are common aggregations; for a complete list, see List of Predefined Aggregations in Tableau.The current aggregation appears as part of the measure's name in the view. For example, Sales becomes SUM(Sales). Every measure has a default aggregation which is set by Tableau when you connect to a data source. You can view or change the default aggregation for a measure---see Set the Default Aggregation for a Measure.You can change the aggregation for a measure in the view from its context menu: In Tableau, you can aggregate measures or dimensions, though it is more common to aggregate measures. Whenever you add a measure to your view, an aggregation is applied to that measure by default. The type of aggregation applied varies depending on the context of the view.
When you add a measure to the view, Tableau automatically aggregates its values. Sum, average, and median are common aggregations; for a complete list, see List of Predefined Aggregations in Tableau.
The current aggregation appears as part of the measure's name in the view. For example, Sales becomes SUM(Sales). Every measure has a default aggregation which is set by Tableau when you connect to a data source. You can view or change the default aggregation for a measure---see Set the Default Aggregation for a Measure.
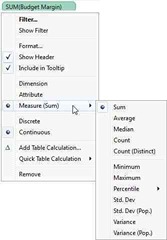
You can change the aggregation for a measure in the view from its context menu:
Question 2
To customize links based on the data in your dashboard, you can automatically enter field values as _______________ in URLs
- parameters
- sets
- values
- inputs
Correct answer: A
Explanation:
A URL action is a hyperlink that points to a web page, file, or other web-based resource outside of Tableau. You can use URL actions to create an email or link to additional information about your data. To customize links based on your data, you can automatically enter field values asparametersin URLs.Read more in depth at :https://help.tableau.com/current/pro/desktop/en-us/actions_url.htm A URL action is a hyperlink that points to a web page, file, or other web-based resource outside of Tableau. You can use URL actions to create an email or link to additional information about your data. To customize links based on your data, you can automatically enter field values asparametersin URLs.
Read more in depth at :https://help.tableau.com/current/pro/desktop/en-us/actions_url.htm
Question 3
Given a map, which of the following fields can be placed on Size,Shape,Detail,Color
- Region, Country, Profit, State
- Sales, State, Country, Profit
- Profit, State, Number of Records, Sales
- Longitude, Country, State, Sales
Correct answer: B
Explanation:
Since Sales is ameasure, it can easily be depicted via size.Todrilldownand change the level of detail, Country is the correct choice since it willcontainSTATE. We can then depict the various states by different shapes such as circle, square etc.Finally, the Profit can be depicted via a color! Eg - Red for poor and green for excellent profits! Since Sales is ameasure, it can easily be depicted via size.
Todrilldownand change the level of detail, Country is the correct choice since it willcontainSTATE. We can then depict the various states by different shapes such as circle, square etc.
Finally, the Profit can be depicted via a color! Eg - Red for poor and green for excellent profits!
Question 4
True or False:When you drag additional tables to the logical layer canvas, Tableau automatically attempts to create the relationship based on existing key constraints and matching fields to define the relationship. If it can't determine the matching fields, then relating these tables is not possible.
- True
- False
Correct answer: B
Explanation:
Tables that you drag to the logical layer of the Data Source page canvas must be related to each other. When you drag additional tables to the logical layer canvas, Tableau automatically attempts to create the relationship based on existing key constraints and matching fields to define the relationship. If it can't determine the matching fields, you will need to select them.If no constraints are detected, aMany-to-manyrelationship is created and referential integrity is set toSome records match. These default settings are a safe choice and provide the most a lot of flexibility for your data source. 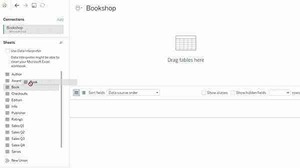
Tables that you drag to the logical layer of the Data Source page canvas must be related to each other. When you drag additional tables to the logical layer canvas, Tableau automatically attempts to create the relationship based on existing key constraints and matching fields to define the relationship. If it can't determine the matching fields, you will need to select them.
If no constraints are detected, aMany-to-manyrelationship is created and referential integrity is set toSome records match. These default settings are a safe choice and provide the most a lot of flexibility for your data source.
Question 5
Which of the following 2 fields CANNOT be deleted in Tableau?
- Number of Records
- Measure Names
- Measure Values
- Calculated Fields
Correct answer: BC
Explanation:
Measure names and valuesCANNOTbe deleted in Tableau like other columns can. These are auto-generated.Calculated Fields, and Number of records can both be deleted. Measure names and valuesCANNOTbe deleted in Tableau like other columns can. These are auto-generated.
Calculated Fields, and Number of records can both be deleted.
Question 6
When you drop a continuous field on Color, Tableau displays a quantitative legend with a ___________ range of colors.
- Discrete
- Fading
- Continuous
- Mixed
Correct answer: C
Explanation:
When you drop a discrete field on Color in the Marks card, Tableau displays a categorical palette and assigns a color to each value of the field.When you drop a continuous field on Color, Tableau displays a quantitative legend with a continuous range of colors.Web version: Desktop Version: For more information about color palettes, see Color Palettes and Effects. When you drop a discrete field on Color in the Marks card, Tableau displays a categorical palette and assigns a color to each value of the field.
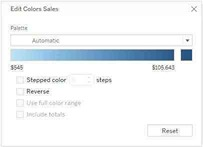
When you drop a continuous field on Color, Tableau displays a quantitative legend with a continuous range of colors.
Web version:
Desktop Version:
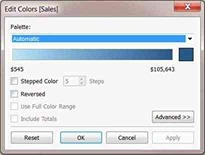
For more information about color palettes, see Color Palettes and Effects.
Question 7
Which of the following are valid ways to add Totals to a view?
- Using the Data Pane
- Using the Analytics Pane
- From the Analysis Tab in the Menu bar on top
- Using the Marks shelf
Correct answer: BC
Explanation:
To add totals to a view using the Analytics pane: Also, you can add totals from the Analytics tab in the Menu above: To add totals to a view using the Analytics pane:
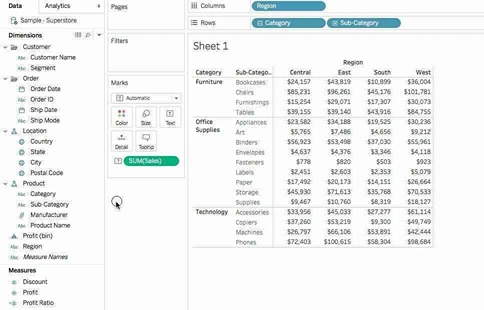
Also, you can add totals from the Analytics tab in the Menu above:
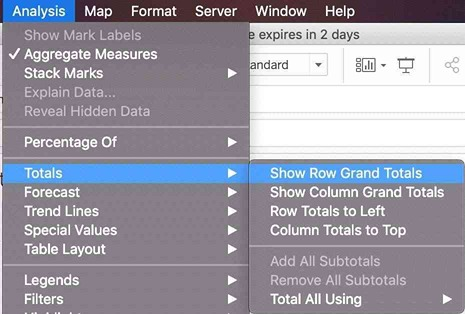
Question 8
Which of the following are valid ways to show Mark Labels in the visualisation?
- Click on the Show mark labels icon in the Toolbar
- Drag the measure to the Text label in the Marks Card
- Click on Data in the Menu bar and Choose Show Mark Labels
- Click on Analysis in the Menu bar and choose Show Mark Labels
Correct answer: ABD
Explanation:
The following showcase how you can show mark labels. Using the Sample Superstore dataset:1) Let's create a Bar chart showing the sales for each sub-category: 2) Now you can show labels by:2.1) Click on Show Mark Labels Icon in the Toolbar ( easiest ) 2.2) Drag Sales to the Text icon in the Marks Card:2.3) Click on Analysis -> Show mark labels from the Tableau menu bar: The following showcase how you can show mark labels. Using the Sample Superstore dataset:
1) Let's create a Bar chart showing the sales for each sub-category:
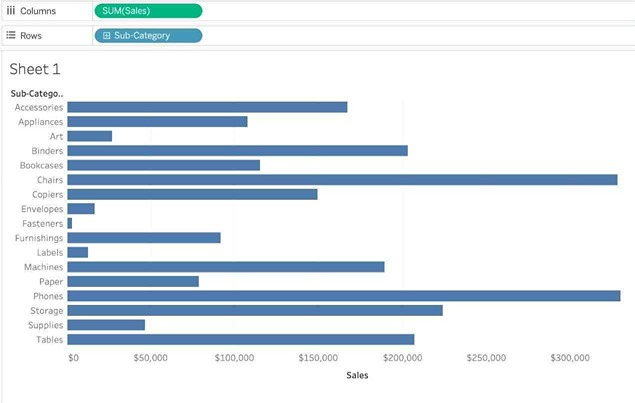
2) Now you can show labels by:
2.1) Click on Show Mark Labels Icon in the Toolbar ( easiest )

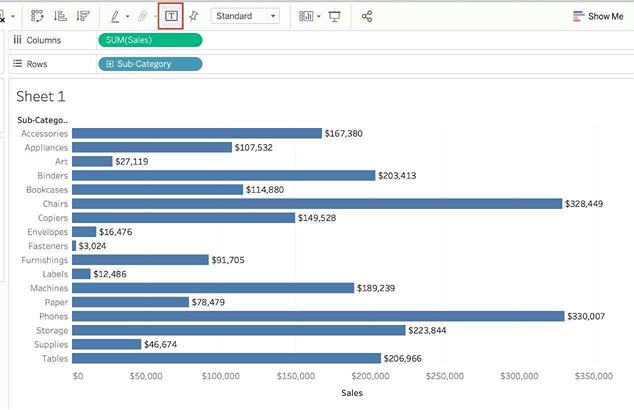
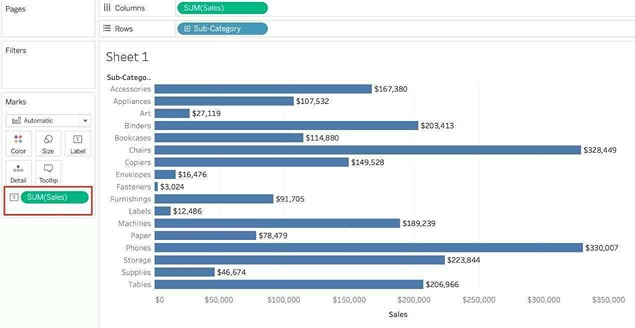
2.2) Drag Sales to the Text icon in the Marks Card:
2.3) Click on Analysis -> Show mark labels from the Tableau menu bar:
Question 9
When using the manage metadata option, we can create custom names for columns where _____________ is the original name of the column whereas _____________ is the custom name we created in Tableau.
- Remote Field Name, Field Name
- Local Name, Actual Name
- Column Name, Actual Name
- Local Field, Global Field
Correct answer: A
Explanation:
Using the Sample superstore as a reference, click on the manage metadata icon as follows: We can rename a particular column name to make it easier to remember and use in Tableau. Let's change Order ID to oID as shown: Now, we'll see oID when using this data source in Tableau. This WILL NOT affect the original data source. The remote field name let's us see what the name of the column is in the ORIGINAL Data source. Using the Sample superstore as a reference, click on the manage metadata icon as follows:
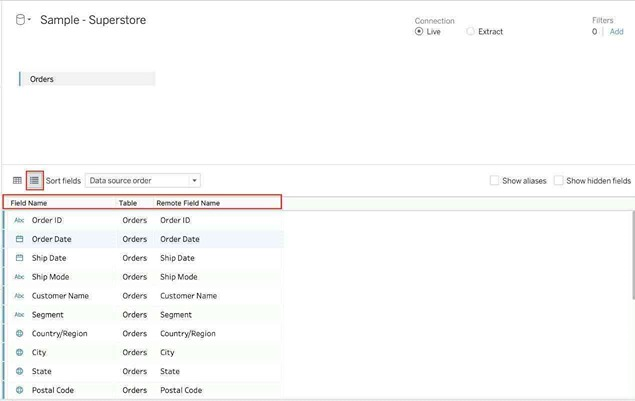
We can rename a particular column name to make it easier to remember and use in Tableau. Let's change Order ID to oID as shown:
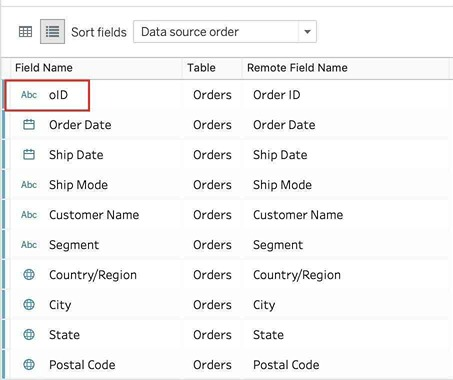
Now, we'll see oID when using this data source in Tableau. This WILL NOT affect the original data source. The remote field name let's us see what the name of the column is in the ORIGINAL Data source.
Question 10
What does the following icon do in Tableau?
Larger image
- Create a Story
- Create a Story and Dashboard both
- Create a Worksheet
- Create a Dashboard
Correct answer: D
Explanation:
The icon shown is used to add a new Dashboard! From the official documentation: The icon shown is used to add a new Dashboard! From the official documentation:

HOW TO OPEN VCE FILES
Use VCE Exam Simulator to open VCE files
HOW TO OPEN VCEX AND EXAM FILES
Use ProfExam Simulator to open VCEX and EXAM files
ProfExam at a 20% markdown
You have the opportunity to purchase ProfExam at a 20% reduced price
Get Now!


