Download Qlik Sense Business Analyst Certification Exam.QSBA2018.TestKing.2019-10-23.30q.vcex
| Vendor: | QlikView |
| Exam Code: | QSBA2018 |
| Exam Name: | Qlik Sense Business Analyst Certification Exam |
| Date: | Oct 23, 2019 |
| File Size: | 1 MB |
How to open VCEX files?
Files with VCEX extension can be opened by ProfExam Simulator.
Discount: 20%
Demo Questions
Question 1
A data architect adds a field to an existing data model that contains new values for the ProductGroup. The business analyst needs to efficiently update the app and meet these requirements:
- Use the existing charts, which are built using a master item dimension called ProductGroup
- Existing charts must use the new values for ProductGroup
- Business users must be able to compare the new and old values
How should the business analyst meet these requirements?
- Change the ProductGroup dimension using the new field, and create a new dimension in the master items for the old field.
- Create a calculated dimension on the charts to allow the users to compare the new value to the old value.
- Replace the dimensions on all charts to use the new ProductGroup field added to the data model.
- Use set analysis on the chart measures to see the difference in ProductGroup between the new field and the old field.
Correct answer: D
Question 2
A client wants to see a bar chart with a single measure and three dimensions: Region, Product Category, and Month.
The business analyst creates a bar chart with the measure, Sum(Revenue).
Which final step should the business analyst take to complete the chart?
- Add Region, Product Category, and Month as three different dimensions
- Create a single master dimension with Region, Product Category, and Month
- Add Region as a dimension, add Product Category and Month as alternate dimensions
- Create a cyclic group with Region, Product Category, and Month as dimensions
Correct answer: A
Question 3
A large organization with more than 100 departments wants to raise money for a donation in the next 30 days. This year, leadership decides to increase employee participation through a competition. Team members of departments that raise $10,000 or more receive two additional holidays.
Leadership needs the following capabilities:
- Ability to view the total donation amount
- Ability to identify departments that raise $10,000 or more
Which two visualizations should the business analyst use without set analysis to meet these requirements? (Choose two.)
- Pie chart
- Box plot
- Bar chart
- KPI
- Treemap
Correct answer: CD
Question 4
A business analyst is building an app for a customer:
The customer wants to be able to:
- Show row-level transaction details
- Access an overview of the most important numbers
- Analyze data
How should the business analyst order the sheets to meet these requirements?
- 1. Dashboard: sheet for the overview2. Report: sheet for the row-level details3. Analysis: sheet for the analysis
- 1. Analysis: sheet for the analysis2. Dashboard: sheet for the overview3. Report: sheet for the row-level details
- 1. Report: sheet for the row-level details2. Dashboard: sheet for the overview3. Analysis: sheet for the analysis
- 1. Dashboard: sheet for the overview2. Analysis: sheet for the analysis3. Report: sheet for the row-level details
Correct answer: C
Question 5
A retailer with 300 locations worldwide needs to analyze its workforce to prepare for its next board meeting. The two most important items to the board members are total compensation and number of employees by city.
Which visualization should a business analyst use to meet this requirement?
- Scatter plot
- Bar chart
- Pivot table
- Map
Correct answer: B
Question 6
A bus company wants to analyze customer travel patterns to add additional services or create new routes.
The business analyst needs to consider the following data:
- 190 routes across the city
- Start and end location of each route
- Volume of customers travelling per hour
- Customer complaints when buses are full
Which visualization should a business analyst use to meet this requirement?
- Area layer map
- Treemap
- Line layer map
- Scatter plot
Correct answer: A
Question 7
A business analyst must adjust and create new visualizations on a published app in Qlik Sense Enterprise. The changes need to be made very quickly.
Which two actions can the business analyst perform in the app on the hub? (Choose two.)
- Duplicate sheets to edit visualizations
- Create new sheets and visualizations
- Add data to the app
- Create and edit master items
- Create variables in the app
Correct answer: AC
Question 8
A business analyst must display current year sales versus previous year sales by region, sub-region, and city.
The result will be a pivot table, with rows for the region, sub-region, and city, and columns for Current Year Sales and Previous Year Sales.
Which calculated expressions should the business analyst create to meet these requirements?
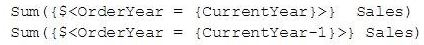


Correct answer: B
Question 9
A business analyst needs to create an app showing sales data. The app requirements are as follows:
- Compare sales for the current year (CY Sales) versus last year (LY Sales)
- CY Sales must always be displayed in blue
- LY Sales must always be displayed in yellow
Which steps should the business analyst take to meet these requirements?
- 1. Create a KPI with two measures, CY Sales and LY Sales2. Write an IF expression to set the appropriate colors for each measure
- 1. Create CY Sales and LY Sales measures as master items2. Write an IF expression to set the appropriate colors for the master items
- 1. Create CY Sales and LY Sales measures as master items and set the required color for each measure2. Create one KPI from the two master item measures
- 1. Create CY Sales and LY Sales measures as master items and set the required color for each measure using Value colors2. Create two gauges, one for each measure and set the color for each appropriately
Correct answer: B
Question 10
A business analyst is creating a dashboard to analyze supply chains. The app must contain several elements:
- A bar chart that shows a number of products and product groups handled by shipper
- A map that shows the number of shipments sent from factory locations
- A bar chart that shows average delivery costs by shipper
Which dimensions should the business analyst use for this app?
- Product, Shipper, FactoryLocation
- Shipper, FactoryLocation
- Shipper, Product
- Product, ProductGroup, Shipper
Correct answer: D
HOW TO OPEN VCE FILES
Use VCE Exam Simulator to open VCE files
HOW TO OPEN VCEX AND EXAM FILES
Use ProfExam Simulator to open VCEX and EXAM files
ProfExam at a 20% markdown
You have the opportunity to purchase ProfExam at a 20% reduced price
Get Now!