Download Microsoft Power BI Data Analyst.PL-300.PremiumDumps.2026-07-08.154q.vcex
| Vendor: | Microsoft |
| Exam Code: | PL-300 |
| Exam Name: | Microsoft Power BI Data Analyst |
| Date: | Jul 08, 2026 |
| File Size: | 14 MB |
How to open VCEX files?
Files with VCEX extension can be opened by ProfExam Simulator.
Discount: 20%

Demo Questions
Question 1
You have a PBIX file that contains sensitive information.
You need to secure the information to meet the following requirements:
- Only internal users must be able to open the file if the file is shared via email.
- Once the file is published, only internal users must be able to open the semantic model and the report downloaded from the Power BI service.
What should you do?
- From Microsoft Power BI Desktop, apply a sensitivity label.
- Certify the semantic model and the report.
- Use a live connection for the file.
- From the Power BI service, apply a sensitivity label.
Correct answer: A
Question 2
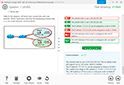
You have a Fabric workspace that contains the items shown in the following table.
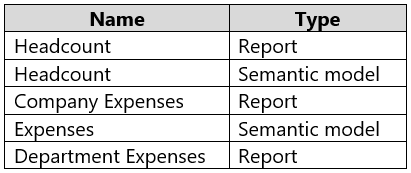
You need to make content available to the management department and the accounting department at your company. The solution must meet the following requirements:
- The management department must have view access to the Headcount and Department Expenses reports.
- The management department must NOT be able to view any other current or future reports.
- The management department must NOT be able to build new reports by using the semantic models.
- The accounting department must only be able to view the Company Expenses report.
- The accounting department must be able to build new reports by using the Expenses semantic model.
The solution must follow the principle of least privilege and minimize administrative effort.
How should you make the content available to the users in each department? To answer, select the appropriate options in the answer area.
NOTE: Each collect selection is worth one point.
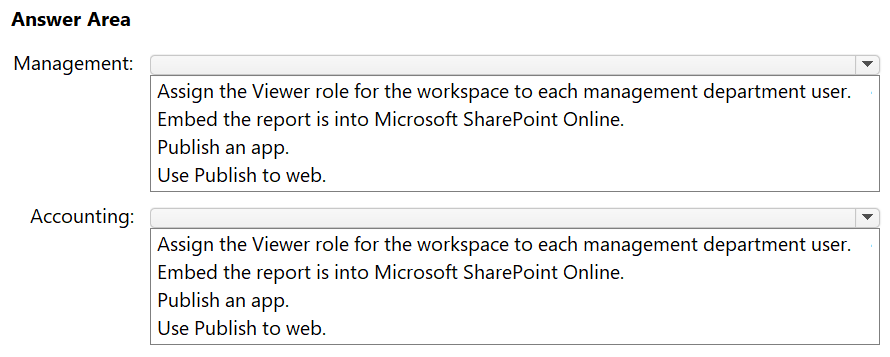
Correct answer: To work with this question, an Exam Simulator is required.
Question 3
You are creating a Power BI report that will contain multiple visuals.
You need to ensure that the report is accessible to users who use a screen reader.
Which two configurations should you perform? Each correct answer presents part of the solution.
NOTE: Each correct selection is worth one point.
- consistent fonts for each visual
- alt text for each visual
- the tab order for each page
- consistent colors for each visual
- Play Axis for each page
Correct answer: B, C
Question 4
You are creating a visual in a Power BI report. The associated semantic model contains sales from the last four years for three products.
You need to display the total sales by quarter categorized by product. The visual must display trends in both total sales and individual product sales.
Which type of visual should you use?
- area chart
- clustered column chart
- stacked area chart
- line chart
Correct answer: C
Question 5
You plan to generate a line chart to visualize and compare the last six months of sales data for two departments.
You need to increase the accessibility of the visual.
What should you do?
- Configure a unique marker for each series.
- Configure a distinct color for each series.
- Replace long text with abbreviations and acronyms.
- Move important information to a tooltip.
Correct answer: A
Question 6
You have a Power BI report that contains a stacked bar chart.
You need to add a new field to the legend. The field must combine information from separate columns.
What should you create?
- a calculated column
- a dynamic format string
- a measure
- a calculation group
Correct answer: A
Question 7
You are using Power BI Desktop to profile data in Power Query Editor.
You need to review the percentage of errors and the maximum value of each column.
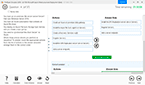
Which options should you use in Power Query Editor? To answer, drag the appropriate options to the correct requirements. Each option may be used once, more than once, or not at all. You may need to drag the split bar between panes or scroll to view content.
NOTE: Each correct selection is worth one point.
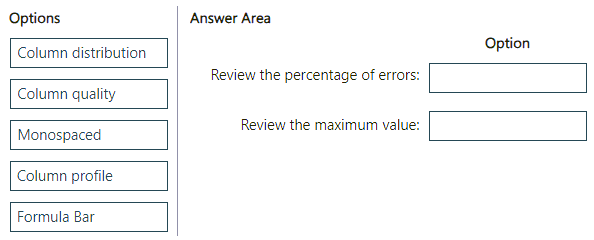
Correct answer: To work with this question, an Exam Simulator is required.
Question 8
You have a Power BI report that contains a clustered bar chart. The chart has an X-axis named Sales and a Y-axis named Year. The chart displays sales data for the years 2020 through 2024.
You need to create a visual calculation to show a cumulative total of sales that is equal to the sum of the current year's sales plus all the sales from the previous year.
Which DAX expression should you use?
- MOVINGAVERAGE([Sales], 4)
- RUNNINGSUM([Year])
- CALCULATE ( [Sales], 'Date' [Year] <= MAX ( 'Date'[Year] ) )
- RUNNINGSUM([Sales])
Correct answer: C
Question 9
You have a Power BI query named Expenses that imports the following data.
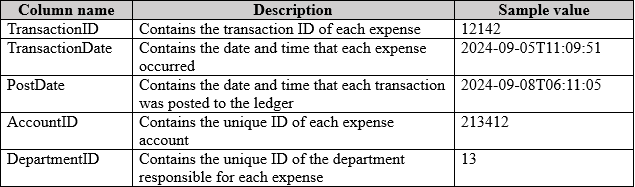
Users only use the date portion of the TransactionDate value when performing data analysis.
You need to minimize the model size without affecting the analysis.
Which two actions should you perform? Each correct answer presents part of the solution.
NOTE: Each correct selection is worth one point.
- Change the data type of the TransactionDate column to Date.
- Change the data type of the PostDate column to Date.
- Remove the PostDate column.
- Remove the TransactionID column.
Correct answer: A, C
Question 10
You have a Power BI semantic model named Model1 that contains two tables named DimDate and FactSales. There is an active relationship between DimDate and FactSales. DimDate is marked as the date table. FactSales contains the following data.
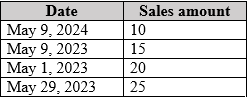
Model1 contains the following measure.
Previous Year Sales = CALCULATE([Sales Amount], PREVIOUSYEAR('Date'[Date]))
You have a report that uses Model1. The report has a single report page that has a page level filter set to May 9, 2024. The result of the Previous Year Sales measure is displayed in a card visual.
Which value will appear in the card visual?
- 10
- 15
- 35
- 60
Correct answer: D
Question 11
You have a Power BI report named Report1.
You plan to share Report1 with multiple users.
You need to add the users to a group.
Which two types of groups can you use? Each correct answer presents a complete solution.
NOTE: Each correct selection is worth one point.
- security group
- distribution group
- Microsoft Teams team
- Microsoft 365 group
Correct answer: A, D
HOW TO OPEN VCE FILES
Use VCE Exam Simulator to open VCE files
HOW TO OPEN VCEX AND EXAM FILES
Use ProfExam Simulator to open VCEX and EXAM files
ProfExam at a 20% markdown
You have the opportunity to purchase ProfExam at a 20% reduced price
Get Now!