Download Analyzing and Visualizing Data with Microsoft Excel.70-779.NewDumps.2020-10-30.96q.vcex
| Vendor: | Microsoft |
| Exam Code: | 70-779 |
| Exam Name: | Analyzing and Visualizing Data with Microsoft Excel |
| Date: | Oct 30, 2020 |
| File Size: | 8 MB |
How to open VCEX files?
Files with VCEX extension can be opened by ProfExam Simulator.
Discount: 20%
Demo Questions
Question 1
Note: This question is part of a series of questions that present the same scenario. Each question in the series contains a unique solution that might meet the stated goals. Some question sets might have more than one correct solution, while others might not have a correct solution.
After you answer a question in this section, you will NOT be able to return to it. As a result, these questions will not appear in the review screen.
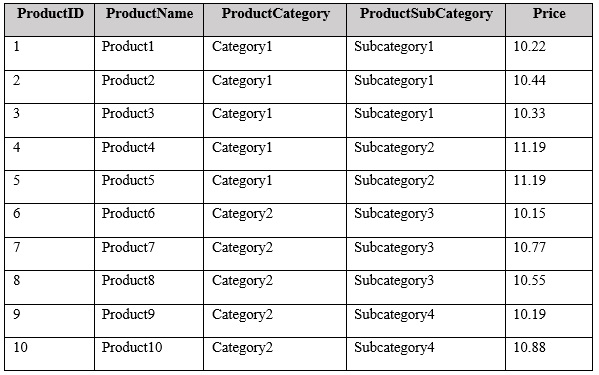
You have an Excel workbook that contains a table named Table1. A sample of the data in Table1 is shown in the following table.

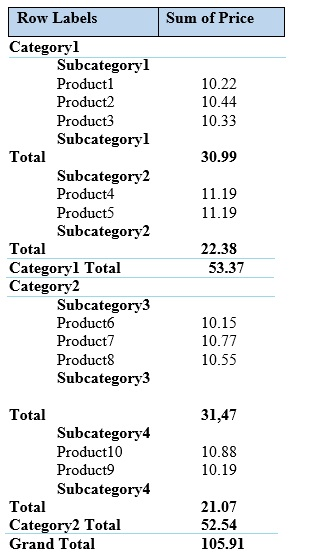
You need to create a PivotTable in PowerPivot as shown in the exhibit. (Click the Exhibit button.)

Solution: You create a measure named products the uses the DataTable DAX function. You add a PivotTable. You drag Products to the Rows field. You drag Price to the Values field.
Does this meet the goal?
- Yes
- No
Correct answer: B
Question 2
Note: This question is part of a series of questions that present the same scenario. Each question in the series contains a unique solution that might meet the stated goals. Some question sets might have more than one correct solution, while others might not have a correct solution.
After you answer a question in this section, you will NOT be able to return to it. As a result, these questions will not appear in the review screen.
You have an Excel workbook that contains a table named Table1. A sample of the data in Table1 is shown in the following table.
You need to create a PivotTable in PowerPivot as shown in the exhibit. (Click the Exhibit button.)
Solution: You create a hierarchy named Products that contains ProductCategory, ProductSubCategory, and ProductName. You add a PivotTable. You drag Products to the Rows field. You drag Price to the Values field.
Does this meet the goal?
- Yes
- No
Correct answer: A
Question 3
Note: This question is part of a series of questions that present the same scenario. Each question in the series contains a unique solution that might meet the stated goals. Some question sets might have more than one correct solution, while others might not have a correct solution.
After you answer a question in this section, you will NOT be able to return to it. As a result, these questions will not appear in the review screen.
You have an Excel workbook that contains a table named Table1. A sample of the data in Table1 is shown in the following table.
You need to create a PivotTable in PowerPivot as shown in the exhibit. (Click the Exhibit button.)
Solution: You add a PivotTable. You drag ProductCategory, ProductSubCategory, and ProductName to the Rows field. You drag Price to the Values field.
Does this meet the goal?
- Yes
- No
Correct answer: B
Question 4
Note: This question is part of a series of questions that present the same scenario. Each question in the series contains a unique solution that might meet the stated goals. Some question sets might have more than one correct solution, while others might not have a correct solution.
After you answer a question in this section, you will NOT be able to return to it. As a result, these questions will not appear in the review screen.
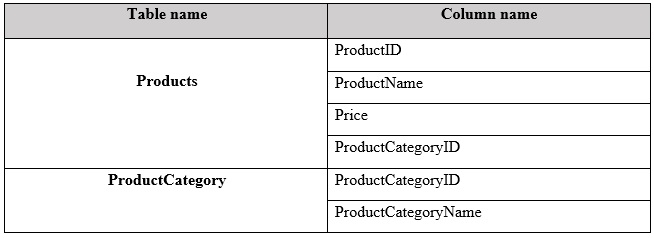
You have a Power Pivot model that contains the following tables.
There is a relationship between Products and ProductCategory.
You need to create a hierarchy in Products that contains ProductCategoryName and ProductName.
Solution: You create a measure that uses the USERELATIONSHIP DAX function.
Does this meet the goal?
- Yes
- No
Correct answer: B
Question 5
Note: This question is part of a series of questions that present the same scenario. Each question in the series contains a unique solution that might meet the stated goals. Some question sets might have more than one correct solution, while others might not have a correct solution.
After you answer a question in this section, you will NOT be able to return to it. As a result, these questions will not appear in the review screen.
You have a Power Pivot model that contains the following tables.

There is a relationship between Products and ProductCategory.
You need to create a hierarchy in Products that contains ProductCategoryName and ProductName.
Solution: You create a calculated column that uses the RELATED DAX function
Does this meet the goal?
- Yes
- No
Correct answer: A
Explanation:
References:https://www.mssqltips.com/sqlservertip/2900/creating-hierarchies-in-powerpivot-for-excel/https://msdn.microsoft.com/en-us/library/ee634202.aspx References:
https://www.mssqltips.com/sqlservertip/2900/creating-hierarchies-in-powerpivot-for-excel/
https://msdn.microsoft.com/en-us/library/ee634202.aspx
Question 6
Note: This question is part of a series of questions that present the same scenario. Each question in the series contains a unique solution that might meet the stated goals. Some question sets might have more than one correct solution, while others might not have a correct solution.
After you answer a question in this section, you will NOT be able to return to it. As a result, these questions will not appear in the review screen.
You have a Power Pivot model that contains the following tables.
There is a relationship between Products and ProductCategory.
You need to create a hierarchy in Products that contains ProductCategoryName and ProductName.
Solution: You create a measure that uses the ISCROSSFILTERED DAX function
Does this meet the goal?
- Yes
- No
Correct answer: B
Question 7
Note: This question is part of a series of questions that use the same scenario. For your convenience, the scenario is repeated in each question. Each question presents a different goal and answer choices, but the text of the scenario is the same in each question in this series.
Start of repeated scenario.
You have six workbook queries that each extracts a table from a Microsoft Azure SQL database. The tables are loaded to the data model, but the data is not loaded to any worksheets. The data model is shown in the Data Model exhibit. (Click the Exhibit button.)
Exhibit:
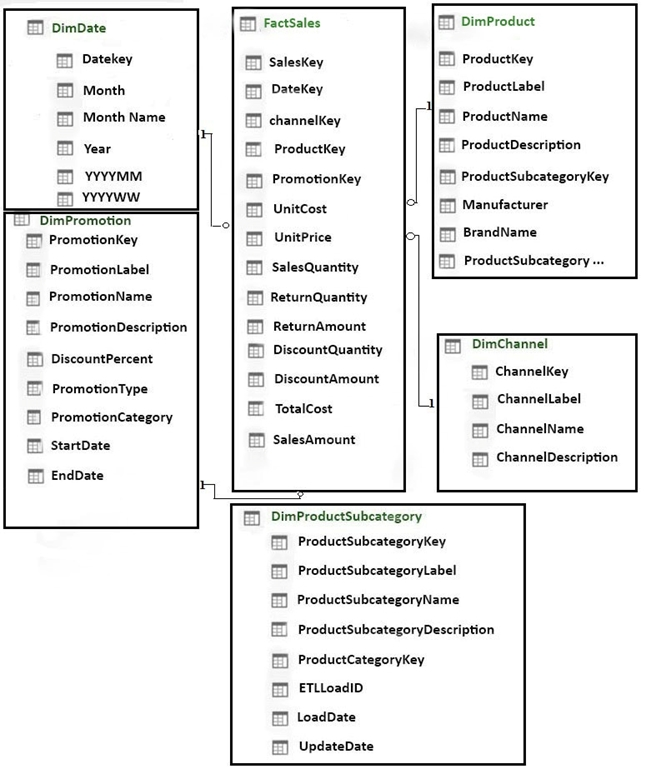
Your company has 100 product subcategories and more than 10,000 products.
End of repeated scenario.
You need to create a measure named [Sales Monthly RT] that calculates a running total of [Sales] for each date within a month as shown in the following exhibit.
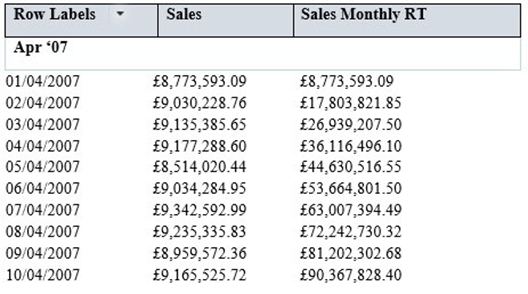
How should you complete the DAX formula? To answer, select the appropriate options in the answer area.
NOTE: Each correct selection is worth one point.
Correct answer: To work with this question, an Exam Simulator is required.
Explanation:
References:https://msdn.microsoft.com/en-us/library/ee634557.aspxhttp://radacad.com/previous-dynamic-period-dax-calculation References:
https://msdn.microsoft.com/en-us/library/ee634557.aspx
http://radacad.com/previous-dynamic-period-dax-calculation
Question 8
Note: This question is part of a series of questions that use the same scenario. For your convenience, the scenario is repeated in each question. Each question presents a different goal and answer choices, but the text of the scenario is the same in each question in this series.
Start of repeated scenario.
You have six workbook queries that each extracts a table from a Microsoft Azure SQL database. The tables are loaded to the data model, but the data is not loaded to any worksheets. The data model is shown in the Data Model exhibit. (Click the Exhibit button.)
Exhibit:
Your company has 100 product subcategories and more than 10,000 products.
End of repeated scenario.
You need to create a chart as shown in the following exhibit.
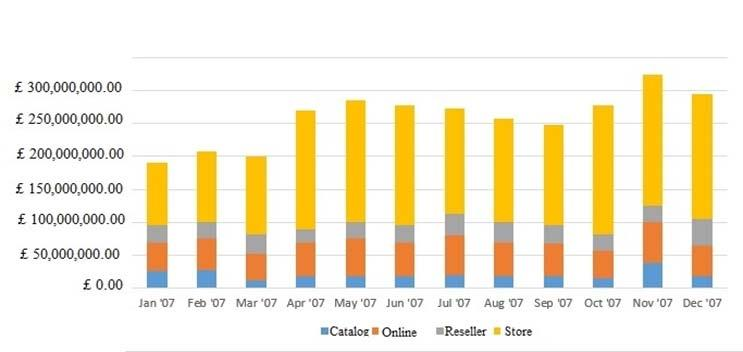
Which field should you use for each area? To answer, drag the appropriate fields to the correct areas. Each field may be used once, more than once, or not at all. You may need to drag the split bar between panes or scroll to view content.
NOTE: Each correct selection is worth one point.
Correct answer: To work with this question, an Exam Simulator is required.
Question 9
Note: This question is part of a series of questions that use the same scenario. For your convenience, the scenario is repeated in each question. Each question presents a different goal and answer choices, but the text of the scenario is the same in each question in this series.
Start of repeated scenario.
You have six workbook queries that each extracts a table from a Microsoft Azure SQL database. The tables are loaded to the data model, but the data is not loaded to any worksheets. The data model is shown in the Data Model exhibit. (Click the Exhibit button.)
Exhibit:
Your company has 100 product subcategories and more than 10,000 products.
End of repeated scenario.
You need to create a simplified view of the workbook for some users. The simplified view must only display data from FactSales, DimProduct, and DimDate.
What should you do in the data model?
- Click Hide from Client Tools for all the tables except FactSales, DimProduct, and DimDate
- Add the columns from FactSales, DimProduct, and DimDate to the Default Field Set
- Create a new perspective
- Modify the Table behavior settings for FactSales, DimProduct, and DimDate
Correct answer: A
Explanation:
References: https://support.office.com/en-us/article/hide-columns-and-tables-in-power-pivot-ddf5b1f2-2ed2-4bdb-8f78-6f94503ca87a References: https://support.office.com/en-us/article/hide-columns-and-tables-in-power-pivot-ddf5b1f2-2ed2-4bdb-8f78-6f94503ca87a
Question 10
Note: This question is part of a series of questions that use the same scenario. For your convenience, the scenario is repeated in each question. Each question presents a different goal and answer choices, but the text of the scenario is the same in each question in this series.
Start of repeated scenario.
You have six workbook queries that each extracts a table from a Microsoft Azure SQL database. The tables are loaded to the data model, but the data is not loaded to any worksheets. The data model is shown in the Data Model exhibit. (Click the Exhibit button.)
Exhibit:
Your company has 100 product subcategories and more than 10,000 products.
End of repeated scenario.
You have a PivotChart that uses Manufacturer as the axis and the sum of SalesAmount as the values.
You need to ensure that only the top 10 manufacturers appear in the chart.
What should you do?
- Configure the Value Filters
- Summarize the SaleAmount field by Max
- Change the format of the SalesAmount field
- Create a calculated column
Correct answer: A
Explanation:
References: https://www.exceldashboardtemplates.com/how-to-easily-make-a-dynamic-pivottable-pie-chart-for-the-top-x-values/ References: https://www.exceldashboardtemplates.com/how-to-easily-make-a-dynamic-pivottable-pie-chart-for-the-top-x-values/
HOW TO OPEN VCE FILES
Use VCE Exam Simulator to open VCE files
HOW TO OPEN VCEX AND EXAM FILES
Use ProfExam Simulator to open VCEX and EXAM files

ProfExam at a 20% markdown
You have the opportunity to purchase ProfExam at a 20% reduced price
Get Now!