Download Analyzing and Visualizing Data with Microsoft Excel.70-779.ActualTests.2019-09-15.46q.vcex
| Vendor: | Microsoft |
| Exam Code: | 70-779 |
| Exam Name: | Analyzing and Visualizing Data with Microsoft Excel |
| Date: | Sep 15, 2019 |
| File Size: | 3 MB |
How to open VCEX files?
Files with VCEX extension can be opened by ProfExam Simulator.
Discount: 20%
Demo Questions
Question 1
Note: This question is part of a series of questions that present the same scenario. Each question in the series contains a unique solution that might meet the stated goals. Some question sets might have more than one correct solution, while others might not have a correct solution.
After you answer a question in this section, you will NOT be able to return to it. As a result, these questions will not appear in the review screen.
You have a Power Pivot model that contains the following tables.
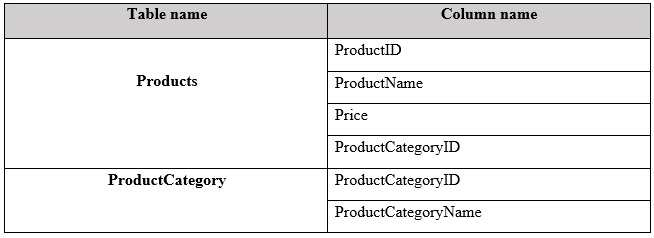
There is a relationship between Products and ProductCategory.
You need to create a hierarchy in Products that contains ProductCategoryName and ProductName.
Solution: You create a calculated column that uses the RELATED DAX function
Does this meet the goal?
- Yes
- No
Correct answer: A
Explanation:
References:https://www.mssqltips.com/sqlservertip/2900/creating-hierarchies-in-powerpivot-for-excel/https://msdn.microsoft.com/en-us/library/ee634202.aspx References:
https://www.mssqltips.com/sqlservertip/2900/creating-hierarchies-in-powerpivot-for-excel/
https://msdn.microsoft.com/en-us/library/ee634202.aspx
Question 2
Note: This question is part of a series of questions that present the same scenario. Each question in the series contains a unique solution that might meet the stated goals. Some question sets might have more than one correct solution, while others might not have a correct solution.
After you answer a question in this section, you will NOT be able to return to it. As a result, these questions will not appear in the review screen.
You have a Power Pivot model that contains the following tables.
There is a relationship between Products and ProductCategory.
You need to create a hierarchy in Products that contains ProductCategoryName and ProductName.
Solution: You create a measure that uses the ISCROSSFILTERED DAX function
Does this meet the goal?
- Yes
- No
Correct answer: B
Question 3
Note: This question is part of a series of questions that use the same scenario. For your convenience, the scenario is repeated in each question. Each question presents a different goal and answer choices, but the text of the scenario is the same in each question in this series.
Start of repeated scenario.
You have six workbook queries that each extracts a table from a Microsoft Azure SQL database. The tables are loaded to the data model, but the data is not loaded to any worksheets. The data model is shown in the Data Model exhibit. (Click the Exhibit button.)
Exhibit:
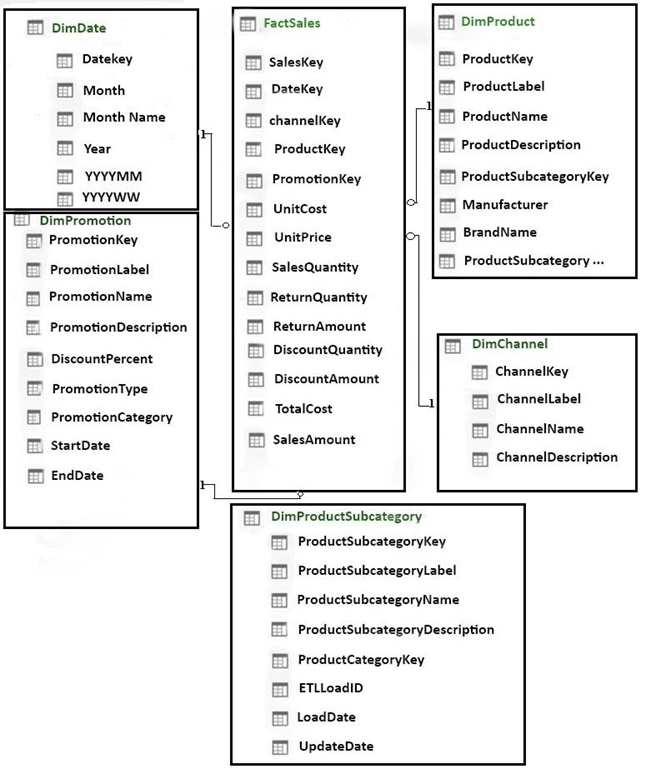
Your company has 100 product subcategories and more than 10,000 products.
End of repeated scenario.
You need to create a simplified view of the workbook for some users. The simplified view must only display data from FactSales, DimProduct, and DimDate.
What should you do in the data model?
- Click Hide from Client Tools for all the tables except FactSales, DimProduct, and DimDate
- Add the columns from FactSales, DimProduct, and DimDate to the Default Field Set
- Create a new perspective
- Modify the Table behavior settings for FactSales, DimProduct, and DimDate
Correct answer: A
Explanation:
References: https://support.office.com/en-us/article/hide-columns-and-tables-in-power-pivot-ddf5b1f2-2ed2-4bdb-8f78-6f94503ca87a References: https://support.office.com/en-us/article/hide-columns-and-tables-in-power-pivot-ddf5b1f2-2ed2-4bdb-8f78-6f94503ca87a
Question 4
You have a table that contains data relating to exam candidates and their associated exam scores.
You need to visualize the exam data by separating the data into quartiles. The visualization must display the mean score and must identify any outliers.
Which type of chart should you use?
- line
- pie
- box and whisker
- histogram
Correct answer: C
Explanation:
References: https://support.office.com/en-us/article/create-a-box-and-whisker-chart-62f4219f-db4b-4754-aca8-4743f6190f0d References: https://support.office.com/en-us/article/create-a-box-and-whisker-chart-62f4219f-db4b-4754-aca8-4743f6190f0d
Question 5
You have a KPI named Goal that calculates the sales from the previous year and multiplies the sales by 1.1.
You need to modify Goal to multiply the sales from the previous year by 1.15.
What should you do?
- From Power Pivot, modify the measure
- From Power Pivot, create a new calculated column, and then modify the KPI
- From the properties of the KPI, modify the absolute value
- From the properties of the KPI, modify the KPI base field
Correct answer: D
Explanation:
References: https://support.office.com/en-us/article/key-performance-indicators-kpis-in-power-view-230d7f15-731e-47a5-9938-fa0f02e6b676#__toc351738129 References: https://support.office.com/en-us/article/key-performance-indicators-kpis-in-power-view-230d7f15-731e-47a5-9938-fa0f02e6b676#__toc351738129
Question 6
You have an Excel spreadsheet that contains a PivotChart.
You install Microsoft Power BI Publisher for Excel.
You need to add a tile for the PivotChart to a Power BI dashboard.
What should you do?
- From powerbi.com, click Get apps
- From powerbi.com, upload the Excel workbook
- From the File menu in Excel, click Publish
- From the Power BI tab in Excel, click Pin
Correct answer: C
Explanation:
References: https://docs.microsoft.com/en-us/power-bi/service-publish-from-excel References: https://docs.microsoft.com/en-us/power-bi/service-publish-from-excel
Question 7
You have an Excel workbook that contains two tables named User and Activity.
You plan to publish the workbook to the Power BI service.
Users will use Q&A in the Power BI service to perform natural language queries.
You need to ensure that the users can query the term employee and receive results from the User table.
What should you do before you publish to Power BI?
- From PowerPivot Settings, modify the Language options
- From PowerPivot Settings, modify the Categorization options
- From the Power Pivot model, edit the Synonyms
- From Workbook Connections, add a connection
Correct answer: C
Explanation:
References: http://blog.pragmaticworks.com/optimizing-power-bi-qa-with-synonyms-phrasing-using-cloud-modeling References: http://blog.pragmaticworks.com/optimizing-power-bi-qa-with-synonyms-phrasing-using-cloud-modeling
Question 8
You open C:DataData.xlsx in Excel.
When you attempt to publish the file to Microsoft Power BI, you receive the following error message: “We couldn’t publish to Power BI. Make sure your workbook is saved as an Excel file (.xlsx or .xlsm) and is not password protected.”
You need to ensure that you can publish the file to Power BI.
What should you do first?
- Decrypt the workbook
- Copy the file to a network share
- Add a digital signature to the workbook
- Disable iterative calculation for the workbook
Correct answer: A
Explanation:
References: https://docs.microsoft.com/en-us/power-bi/service-publish-from-excel References: https://docs.microsoft.com/en-us/power-bi/service-publish-from-excel
Question 9
Note: This question is part of a series of questions that use the same scenario. For your convenience, the scenario is repeated in each question. Each question presents a different goal and answer choices, but the text of the scenario is the same in each question in this series.
Start of repeated scenario.
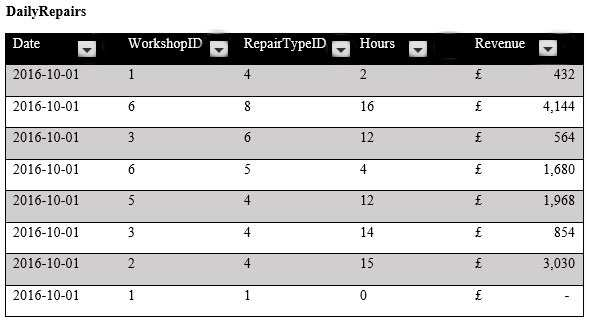
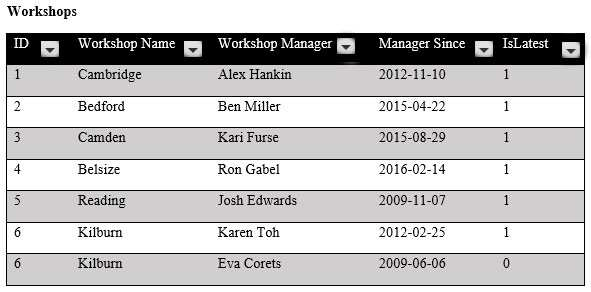
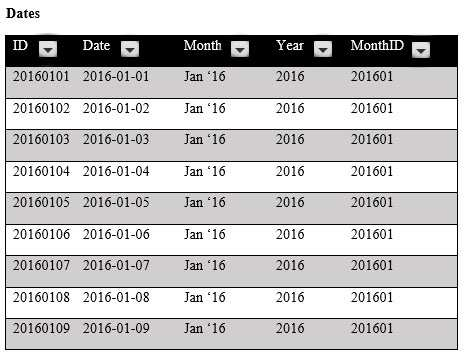
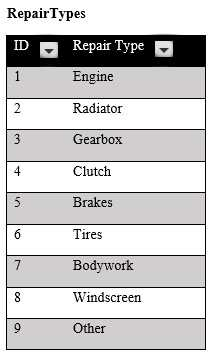
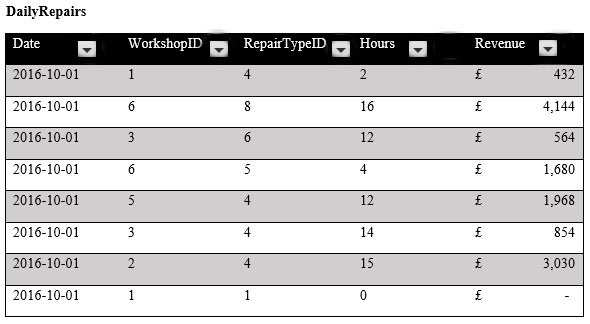
You are creating reports for a car repair company. You have four datasets in Excel spreadsheets. Four workbook queries load the datasets to a data model. A sample of the data is shown in the Data Sample exhibit.
Data Sample exhibit:
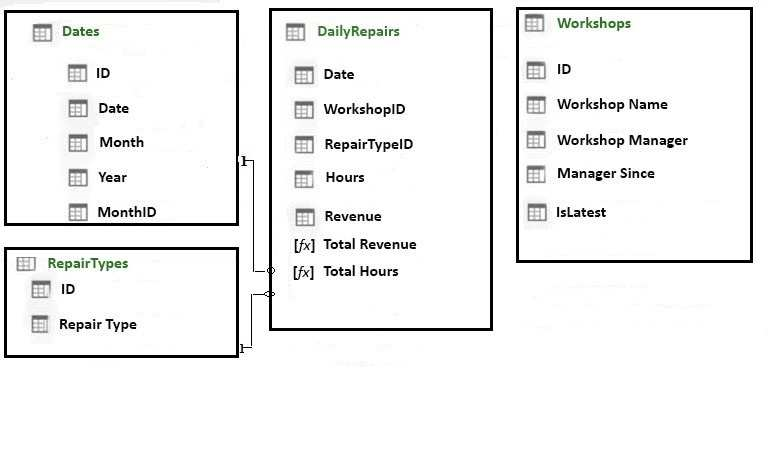
The data model is shown in the Data Model exhibit.
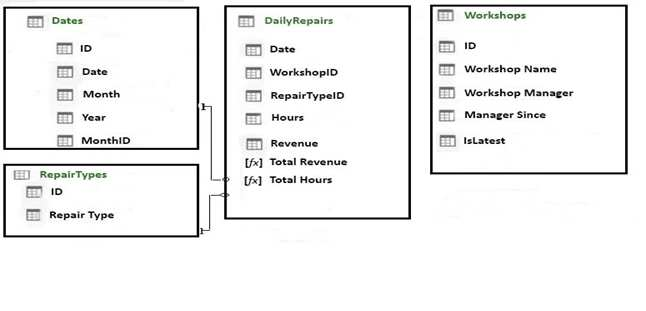
The tables in the model contain the following data:
- DailyRepairs has a log of hours and revenue for each day, workshop, and repair type. Every day, a log entry is created for each workshop, even if no hours or revenue are recorded for that day. Total Hours and Total Revenue column.
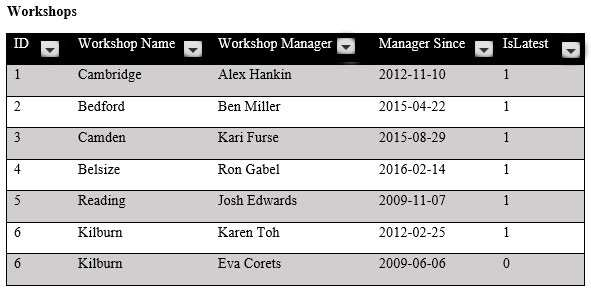
- Workshops have a list of all the workshops and the current and previous workshop managers. The format of the Workshop Manager column is always Firstname Lastname. A value of 1 in the IsLatest column indicates that the workshop manager listed in the record is the current workshop manager.
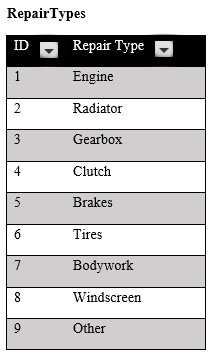
- RepairTypes has a list of all the repair types
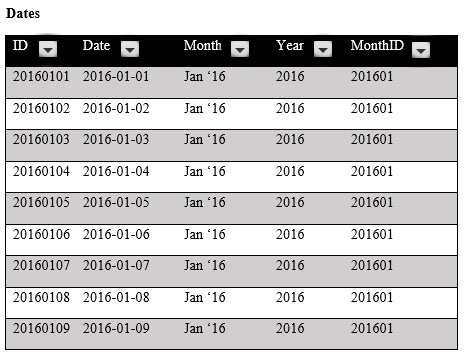
- Dates has a list of dates from 2015 to 2018
End of repeated scenario.
When you attempt to create a relationship between DailyRepairs and Workshops, Power Pivot generates the following error message: “The relationship cannot be created because each column contains duplicate values. Select at least one column that contains only unique values”.
You need to ensure that you can create a valid relationship between the tables.
What should you do?
- In the Power Pivot model, change the data type for Workshop[ID] to General
- In the workbook query for Workshops, add an index column
- In the Power Pivot model, change the Table Behavior setting for Workshops
- In the workbook query for Workshops, filter [IsLatest] to equal 1
Correct answer: C
Explanation:
References: https://msdn.microsoft.com/en-us/library/hh560544(v=sql.110).aspx References: https://msdn.microsoft.com/en-us/library/hh560544(v=sql.110).aspx
Question 10
Note: This question is part of a series of questions that use the same scenario. For your convenience, the scenario is repeated in each question. Each question presents a different goal and answer choices, but the text of the scenario is the same in each question in this series.
Start of repeated scenario.
You are creating reports for a car repair company. You have four datasets in Excel spreadsheets. Four workbook queries load the datasets to a data model. A sample of the data is shown in the Data Sample exhibit.
Data Sample exhibit:
The data model is shown in the Data Model exhibit.
The tables in the model contain the following data:
- DailyRepairs has a log of hours and revenue for each day, workshop, and repair type. Every day, a log entry is created for each workshop, even if no hours or revenue are recorded for that day. Total Hours and Total Revenue column.
- Workshops have a list of all the workshops and the current and previous workshop managers. The format of the Workshop Manager column is always Firstname Lastname. A value of 1 in the IsLatest column indicates that the workshop manager listed in the record is the current workshop manager.
- RepairTypes has a list of all the repair types
- Dates has a list of dates from 2015 to 2018
End of repeated scenario.
You create a measure named Average Revenue Per Hour that calculates the average revenue per hour.
You need to populate a cell in a worksheet to display the Average Revenue Per Hour where Repair Type is Engine.
Which Excel formula should you use?
- =CUBEMEMBER(“ThisWorkbookDataModel”, “[DailyRepairs]. [Avg Revenue Per Hour]”, CUBEMEMBER (“ThisWorkbookDataModel”,“[Dimensions]. [Repair Type]. [Engine]”))
- =CUBEVALUE(“ThisWorkbookDataModel”, “[Measures]. [Avg Revenue Per Hour]”, CUBEMEMBER (“ThisWorkbookDataModel”,“[Dimensions]. [Repair Type]. [Engine]”))
- =CUBEMEMBER(“ThisWorkbookDataModel”, “[DailyRepairs]. [Avg Revenue Per Hour]”, CUBEMEMBER (“ThisWorkbookDataModel”,“[RepairTypes]. [Repair Type]. [Engine]”))
- =CUBEVALUE(“ThisWorkbookDataModel”, “[Measures]. [Avg Revenue Per Hour]”, CUBEMEMBER (“ThisWorkbookDataModel”,“[RepairTypes]. [Repair Type]. [Engine]”))
Correct answer: B
Explanation:
References:https://support.office.com/en-us/article/cubevalue-function-8733da24-26d1-4e34-9b3a-84a8f00dcbe0https://www.tutorialspoint.com/advanced_excel_functions/advanced_excel_cube_cubemember_function.htm References:
https://support.office.com/en-us/article/cubevalue-function-8733da24-26d1-4e34-9b3a-84a8f00dcbe0
https://www.tutorialspoint.com/advanced_excel_functions/advanced_excel_cube_cubemember_function.htm
HOW TO OPEN VCE FILES
Use VCE Exam Simulator to open VCE files
HOW TO OPEN VCEX AND EXAM FILES
Use ProfExam Simulator to open VCEX and EXAM files
ProfExam at a 20% markdown
You have the opportunity to purchase ProfExam at a 20% reduced price
Get Now!