Download Analyzing and Visualizing Data with Microsoft Power BI.70-778.CertKiller.2019-02-05.73q.vcex
| Vendor: | Microsoft |
| Exam Code: | 70-778 |
| Exam Name: | Analyzing and Visualizing Data with Microsoft Power BI |
| Date: | Feb 05, 2019 |
| File Size: | 3 MB |
How to open VCEX files?
Files with VCEX extension can be opened by ProfExam Simulator.
Discount: 20%
Demo Questions
Question 1
You have a workspace that contains 10 dashboards. A dashboard named Sales Data displays data from two datasets. You discover that users are unable to find data on the dashboard by using natural language queries.
You need to ensure that the users can find data by using natural language queries.
What should you do?
- From the settings of the workspace, modify the Language Settings.
- From the Sales Data dashboard, set the dashboard as a Favorite.
- From the properties of the datasets, modify the Q&A and Cortana settings.
- From the properties of the dashboard, modify the Q&A settings.
Correct answer: C
Explanation:
References: https://docs.microsoft.com/en-us/power-bi/service-q-and-a-direct-query#limitations-during-public-preview References: https://docs.microsoft.com/en-us/power-bi/service-q-and-a-direct-query#limitations-during-public-preview
Question 2
You manage a Power BI model that has two tables named Sales and Product.
You need to ensure that a sales team can view only data that has a CountryRegionName value of Unites States and a ProductCategory value of Clothing.
What should you do from Power BI Desktop?
- Add the following filters to a report.CountryRegionName is United StatesProductCategory is Clothing
- From Power BI Desktop, create a new role that has the following filters.[CountryRegionName] = "United States"[ProductCategory] = "Clothing"
- Add the following filters in Query Editor.CountryRegionName is United StatesProductCategory is Clothing
- From Power BI Desktop, create a new role that has the following filter.[CountryRegionName] = "United States" && [ProductCategory] = "Clothing"
Correct answer: A
Explanation:
References: https://docs.microsoft.com/en-us/power-bi/power-bi-how-to-report-filter References: https://docs.microsoft.com/en-us/power-bi/power-bi-how-to-report-filter
Question 3
You create a report in the Power BI service that displays the following visualizations:
- A KPI that displays the count of customers
- A table that displays the count of customers by country
- A line chart that displays the count of customers by year
You need to receive an alert when the total number of customers reaches 10,000.
What should you do first?
- Pin the line chart to a dashboard.
- Pin the KPI to a dashboard.
- Embed the report into a Microsoft SharePoint page.
- Pin the report to a dashboard.
Correct answer: D
Explanation:
References: https://docs.microsoft.com/en-us/power-bi/service-dashboard-pin-tile-from-report References: https://docs.microsoft.com/en-us/power-bi/service-dashboard-pin-tile-from-report
Question 4
You have a Power BI dashboard that displays different visualizations of company sales.
You enable Q&A on the dashboard.
You need to provide users with sample questions that they can ask when using Q&A.
Which settings should you modify form the Power BI Settings?
- Subscriptions
- Workbooks
- Dashboards
- Datasets
Correct answer: D
Explanation:
References: https://docs.microsoft.com/en-us/power-bi/service-q-and-a-create-featured-questions References: https://docs.microsoft.com/en-us/power-bi/service-q-and-a-create-featured-questions
Question 5
You have an app workspace named Retail Store Analysis in the Power BI service.
You need to manage the members that have access to the app workspace using the least amount of administrative effort.
What should you do?
- From the Office 365 Admin center, click Users.
- From the Power BI Admin portal, click Tenant settings.
- From the Power BI Admin portal, click Usage metrics.
- From the Office 365 Admin center, click Groups.
Correct answer: D
Explanation:
References: https://docs.microsoft.com/en-us/power-bi/service-manage-app-workspace-in-power-bi-and-office-365 References: https://docs.microsoft.com/en-us/power-bi/service-manage-app-workspace-in-power-bi-and-office-365
Question 6
Your organization has a Microsoft Office 365 subscription.
When the users attempt to access the Power BI Service, they receive the error message shown in the exhibit.
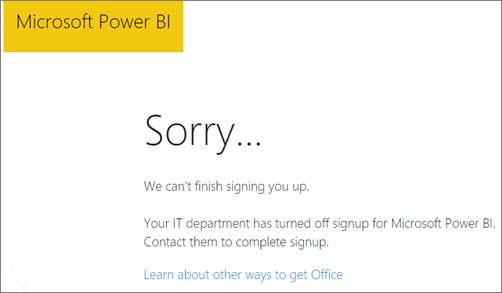
You need to ensure that all the users can access the Power BI service.
What should you do first?
- From the properties of each dashboard, modify the Share dashboard settings.
- From Microsoft Azure PowerShell, run the Set-MsolDomain cmdlet.
- Instruct each user to install Microsoft Office 2016.
- From Microsoft Azure PowerShell, run the Set-MsolCompanySettings cmdlet.
Correct answer: D
Explanation:
References:https://docs.microsoft.com/en-us/power-bi/service-admin-service-free-in-your-organization#enable-or-disable-individual-user-sign-up-in-azure-active-directory References:
https://docs.microsoft.com/en-us/power-bi/service-admin-service-free-in-your-organization#enable-or-disable-individual-user-sign-up-in-azure-active-directory
Question 7
You have a Microsoft Excel spreadsheet that contains a table named Sales.
You need to add the Sales table to a Power BI dashboard as a tile.
How should you configure the tile?
- From the Power BI service, import the data from the Excel workbook.
- From Excel, publish the workbook to the Power BI service.
- From the Power BI tab in Excel, pin the table.
- From the Power BI service, upload the Excel workbook.
Correct answer: C
Explanation:
References: https://docs.microsoft.com/en-us/power-bi/publisher-for-excel References: https://docs.microsoft.com/en-us/power-bi/publisher-for-excel
Question 8
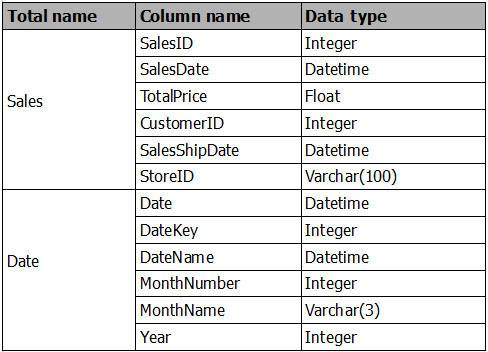
You are creating a report in Power BI Desktop.
You are consuming the following tables.
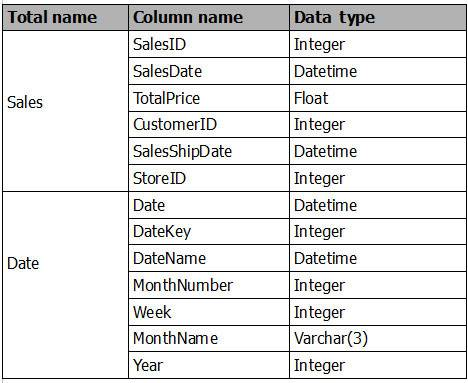
Date[Date] is in the mm/dd/yyyy format. Date[DateKey] is in the ddmmyyyy format. Date[MonthNumber] is in the mm format. Date[MonthName] is in the mmm format.
You create the report shown in the exhibit. (Click the Exhibit button.)
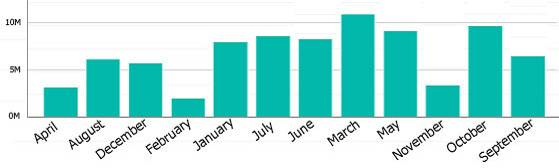
You need to ensure that the months appear in the order of the calendar.
How should you sort the MonthName column?
- by MonthNumber
- ascending
- descending
- by DateKey
Correct answer: A
Explanation:
References: http://ppmworks.com/sorting-month-names-chronologically-in-microsoft-power-bi-reports/ References: http://ppmworks.com/sorting-month-names-chronologically-in-microsoft-power-bi-reports/
Question 9
You are creating a report in Power BI Desktop.
You are consuming the following tables.
You have a new table named Fiscal that has the same schema as the Date table, but contains the fiscal dates of your company.
You need to create a report that displays the total sales by fiscal month and calendar month.
What should you do?
- Union Fiscal and Date as one table.
- Add Fiscal to the model and create a one-to-many relationship by using Date[Year] and Fiscal[Year].
- Add Fiscal to the model and create a one-to-one relationship by using Date[Year] and Fiscal[Year].
- Merge Fiscal into the Date table.
Correct answer: D
Explanation:
References: https://docs.microsoft.com/en-us/power-bi/desktop-shape-and-combine-data References: https://docs.microsoft.com/en-us/power-bi/desktop-shape-and-combine-data
Question 10
You plan to create a Power BI report. You have the schema model shown in the exhibit.
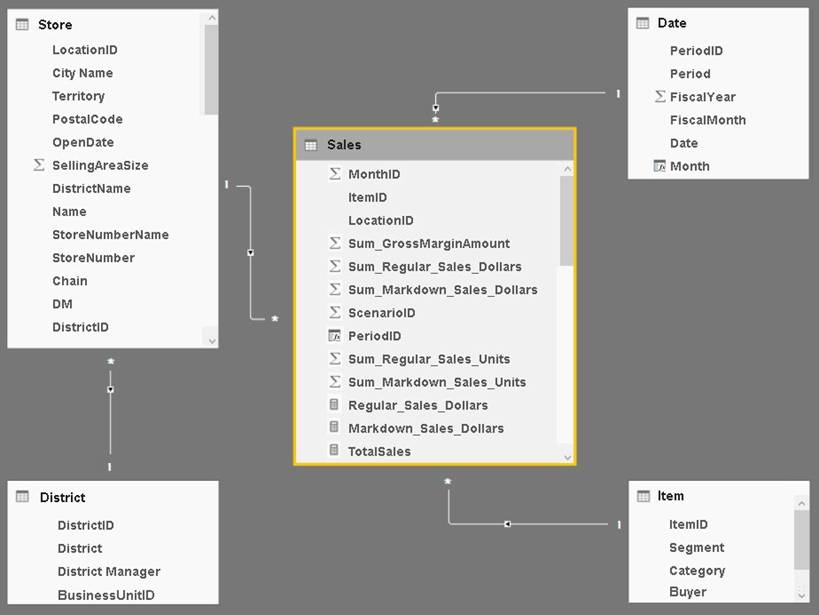
The model has the following relationships:
- Store to District based on DistrictID
- Sales to Store based on LocationID
- Sales to Date based on PeriodID
- Sales to Item based on ItemID
You configure row-level security (RLS) so that the district managers of the stores only see the sales from the stores they manage.
When the district managers view the Store by Items report, they see items for all the stores.
You need to ensure that the district managers can see items for the stores they manage only.
How should you configure the relationship from Sales to Item?
- Select Assume Referential Integrity.
- Change the Cardinality to One to Many (1:*).
- Change the Cross filter direction to Both.
- Change the Cardinality to One to one (1:1).
Correct answer: C
Explanation:
References: https://powerbi.microsoft.com/en-us/guided-learning/powerbi-admin-rls/ References: https://powerbi.microsoft.com/en-us/guided-learning/powerbi-admin-rls/
HOW TO OPEN VCE FILES
Use VCE Exam Simulator to open VCE files
HOW TO OPEN VCEX AND EXAM FILES
Use ProfExam Simulator to open VCEX and EXAM files
ProfExam at a 20% markdown
You have the opportunity to purchase ProfExam at a 20% reduced price
Get Now!