Download CompTIA Data+.DA0-001.VCEplus.2024-08-03.116q.vcex
| Vendor: | CompTIA |
| Exam Code: | DA0-001 |
| Exam Name: | CompTIA Data+ |
| Date: | Aug 03, 2024 |
| File Size: | 3 MB |
| Downloads: | 3 |
How to open VCEX files?
Files with VCEX extension can be opened by ProfExam Simulator.
Discount: 20%
Demo Questions
Question 1
A recurring event is being stored in two databases that are housed in different geographical locations. A data analyst notices the event is being logged three hours earlier in one database than in the other database. Which of the following is the MOST likely cause of the issue?
- The data analyst is not querying the databases correctly.
- The databases are recording different events.
- The databases are recording the event in different time zones.
- The second database is logging incorrectly.
Correct answer: C
Explanation:
The most likely cause of the issue is that the databases are recording the event in different time zones. For example, if one database is in New York and the other database is in Los Angeles, there is a three-hour difference between them. Therefore, an event that occurs at 12:00 PM in New York would be recorded as 9:00 AM in Los Angeles. To avoid this issue, the databases should either use a common time zone or convert the timestamps to a standard format. Therefore, option C is correct.Option A is incorrect because the data analyst is not querying the databases incorrectly, but rather observing a discrepancy in the timestamps.Option B is incorrect because the databases are recording the same event, but with different timestamps.Option D is incorrect because the second database is not logging incorrectly, but rather using a different time zone. The most likely cause of the issue is that the databases are recording the event in different time zones. For example, if one database is in New York and the other database is in Los Angeles, there is a three-hour difference between them. Therefore, an event that occurs at 12:00 PM in New York would be recorded as 9:00 AM in Los Angeles. To avoid this issue, the databases should either use a common time zone or convert the timestamps to a standard format. Therefore, option C is correct.
Option A is incorrect because the data analyst is not querying the databases incorrectly, but rather observing a discrepancy in the timestamps.
Option B is incorrect because the databases are recording the same event, but with different timestamps.
Option D is incorrect because the second database is not logging incorrectly, but rather using a different time zone.
Question 2
Which of the following is an example of a at flat file?
- CSV file
- PDF file
- JSON file
- JPEG file
Correct answer: D
Question 3
Refer to the exhibit.
Given the following graph:
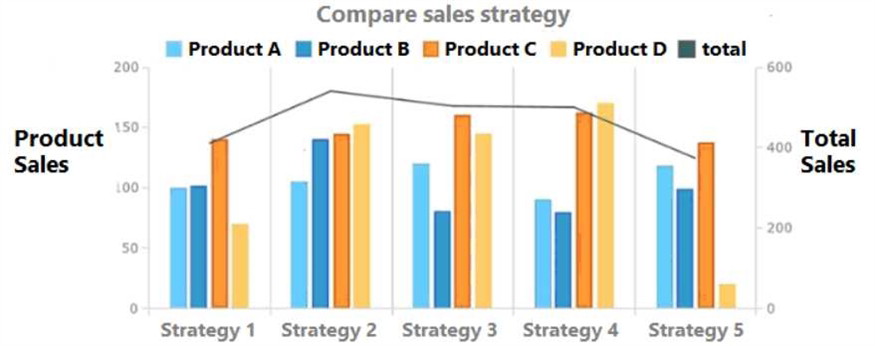
Which of the following summary statements upholds integrity in data reporting?
- Sales are approximately equal for Product A and Product B across all strategies.
- Strategy 4 provides the best sales in comparison to other strategies.
- While Strategy 2 does not result in the highest sales of Product D, over all products it appears to be the most effective.
- Product D should be promoted more than the other products in all strategies.
Correct answer: B
Explanation:
Strategy 4 provides the best sales in comparison to other strategies. This is because the total sales for Strategy 4 are the highest among all the strategies, as shown by the black line. The other statements are not accurate or do not uphold integrity in data reporting. Here is why:Statement A is false because sales are not approximately equal for Product A and Product B across all strategies. For example, in Strategy 1, Product A has more sales than Product B, while in Strategy 3, Product B has more sales than Product A. Statement C is misleading because it does not account for the difference in scale between the products. While Strategy 2 has the highest total sales among all products, it does not necessarily mean that it is the most effective for each product. For instance, Product D has very low sales in Strategy 2 compared to other strategies.Statement D is biased because it does not provide any evidence or justification for why Product D should be promoted more than the other products in all strategies. It also ignores the fact that Product D has the lowest sales among all products in most of the strategies. Strategy 4 provides the best sales in comparison to other strategies. This is because the total sales for Strategy 4 are the highest among all the strategies, as shown by the black line. The other statements are not accurate or do not uphold integrity in data reporting. Here is why:
Statement A is false because sales are not approximately equal for Product A and Product B across all strategies. For example, in Strategy 1, Product A has more sales than Product B, while in Strategy 3, Product B has more sales than Product A.
Statement C is misleading because it does not account for the difference in scale between the products. While Strategy 2 has the highest total sales among all products, it does not necessarily mean that it is the most effective for each product. For instance, Product D has very low sales in Strategy 2 compared to other strategies.
Statement D is biased because it does not provide any evidence or justification for why Product D should be promoted more than the other products in all strategies. It also ignores the fact that Product D has the lowest sales among all products in most of the strategies.
Question 4
You should always choose the analytics tool that is most appropriate for any given situation, even if that means acquiring a new tool.
- True.
- False.
Correct answer: B
Explanation:
The statement is false. You should not always choose the analytics tool that is most appropriate for any given situation, even if that means acquiring a new tool. Acquiring a new tool can be costly, time-consuming, and risky, as it may not be compatible with your existing data sources, systems, or processes. It may also require additional training, maintenance, and support. Therefore, you should always consider the trade-offs between the benefits and drawbacks of acquiring a new tool versus using an existing one. You should also evaluate the feasibility, availability, and reliability of the new tool before making a decision. Reference: CompTIA Data+ (DA0-001) PracticeCertification Exams | Udemy The statement is false. You should not always choose the analytics tool that is most appropriate for any given situation, even if that means acquiring a new tool. Acquiring a new tool can be costly, time-consuming, and risky, as it may not be compatible with your existing data sources, systems, or processes. It may also require additional training, maintenance, and support. Therefore, you should always consider the trade-offs between the benefits and drawbacks of acquiring a new tool versus using an existing one. You should also evaluate the feasibility, availability, and reliability of the new tool before making a decision. Reference: CompTIA Data+ (DA0-001) Practice
Certification Exams | Udemy
Question 5
What R package makes it easy to work with dates?
- Lubridate.
- Datemath.
- Stringr.
- ggplot.
Correct answer: A
Explanation:
Lubridate is an R package that makes it easier to work with dates and times. Lubridate is an R package that makes it easier to work with dates and times.
Question 6
You have two databases tables that you would like to join together using a foreign key relationship.
What term best describes this action?
- Blending.
- Appending.
- Mixing.
- Merging.
Correct answer: D
Explanation:
Data merging is the process of combining two or more data sets into a single data set. Most often, this process is necessary when you have raw data stored in multiple files, worksheets, or data tables, that you want to analyze all in one go. Data merging is the process of combining two or more data sets into a single data set. Most often, this process is necessary when you have raw data stored in multiple files, worksheets, or data tables, that you want to analyze all in one go.
Question 7
Which one of the following values will appear first if they are sorted in descending order?
- Aaron.
- Molly.
- Xavier.
- Adam.
Correct answer: C
Explanation:
The value that will appear first if they are sorted in descending order is Xavier. Descending order means arranging values from the largest to the smallest, or from the last to the first in alphabetical order. In this case, Xavier is the last name in alphabetical order, so it will appear first when sorted in descending order. The other names will appear in the following order: Molly, Adam, Aaron.Reference: Sorting Data - W3Schools The value that will appear first if they are sorted in descending order is Xavier. Descending order means arranging values from the largest to the smallest, or from the last to the first in alphabetical order. In this case, Xavier is the last name in alphabetical order, so it will appear first when sorted in descending order. The other names will appear in the following order: Molly, Adam, Aaron.
Reference: Sorting Data - W3Schools
Question 8
Which one the following is not considered an aggregate function?
- SUM
- MIN
- SELECT
- MAX
Correct answer: C
Explanation:
The option that is not considered an aggregate function is SELECT. An aggregate function is a function that performs a calculation on a set of values and returns a single value. Examples of aggregate functions are SUM, MIN, MAX, AVG, COUNT, etc. SELECT is not an aggregate function, but a SQL command that is used to select data from a table or a query. Reference: SQL Aggregate Functions -W3Schools The option that is not considered an aggregate function is SELECT. An aggregate function is a function that performs a calculation on a set of values and returns a single value. Examples of aggregate functions are SUM, MIN, MAX, AVG, COUNT, etc. SELECT is not an aggregate function, but a SQL command that is used to select data from a table or a query. Reference: SQL Aggregate Functions -W3Schools
Question 9
You are working with a dataset and want to change the names of categories that you used for different types of books.
What term best describes this action?
- Recording.
- Summarizing
- Aggregating.
- Filtering.
Correct answer: A
Explanation:
The term that best describes the action of changing the names of categories that you used for different types of books is recoding. Recoding is a process of transforming or modifying the values of a variable or a category to make them more meaningful, consistent, or accurate. For example, you can recode the names of book genres from "Fiction", "Non-Fiction", "Biography", etc. to "FIC", "NF", "BIO", etc. to make them shorter and easier to use.Reference: Recoding Data - SPSS Tutorials -LibGuides at Kent State University The term that best describes the action of changing the names of categories that you used for different types of books is recoding. Recoding is a process of transforming or modifying the values of a variable or a category to make them more meaningful, consistent, or accurate. For example, you can recode the names of book genres from "Fiction", "Non-Fiction", "Biography", etc. to "FIC", "NF", "BIO", etc. to make them shorter and easier to use.
Reference: Recoding Data - SPSS Tutorials -LibGuides at Kent State University
Question 10
Joseph is interpreting a left skewed distribution of test scores. Joe scored at the mean, Alfonso scored at the median, and gaby scored and the end of the tail.
Who had the highest score?
- Joseph
- Joe
- Alfonso
- Gaby
Correct answer: C
Explanation:
Alfonso had the highest score. A left skewed distribution is a distribution where the tail is longer on the left side than on the right side, meaning that most of the values are clustered on the right side and there are some outliers on the left side. In a left skewed distribution, the mean is less than the median, which is less than the mode. Therefore, Joseph, who scored at the mean, had the lowest score, Gaby, who scored at the end of the tail, had the second lowest score, and Alfonso, who scored at the median, had the highest score. Reference: Skewness - Statistics How To Alfonso had the highest score. A left skewed distribution is a distribution where the tail is longer on the left side than on the right side, meaning that most of the values are clustered on the right side and there are some outliers on the left side. In a left skewed distribution, the mean is less than the median, which is less than the mode. Therefore, Joseph, who scored at the mean, had the lowest score, Gaby, who scored at the end of the tail, had the second lowest score, and Alfonso, who scored at the median, had the highest score. Reference: Skewness - Statistics How To
HOW TO OPEN VCE FILES
Use VCE Exam Simulator to open VCE files
HOW TO OPEN VCEX AND EXAM FILES
Use ProfExam Simulator to open VCEX and EXAM files

ProfExam at a 20% markdown
You have the opportunity to purchase ProfExam at a 20% reduced price
Get Now!