Download Cisco AppDynamics Associate Performance Analyst (CAAPA).500-420.VCEDumps.2024-04-05.31q.vcex
| Vendor: | Cisco |
| Exam Code: | 500-420 |
| Exam Name: | Cisco AppDynamics Associate Performance Analyst (CAAPA) |
| Date: | Apr 05, 2024 |
| File Size: | 540 KB |
| Downloads: | 1 |
How to open VCEX files?
Files with VCEX extension can be opened by ProfExam Simulator.
Discount: 20%
Demo Questions
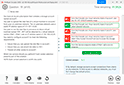
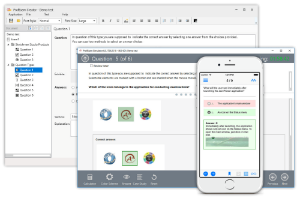
Question 1
Refer to exhibit.
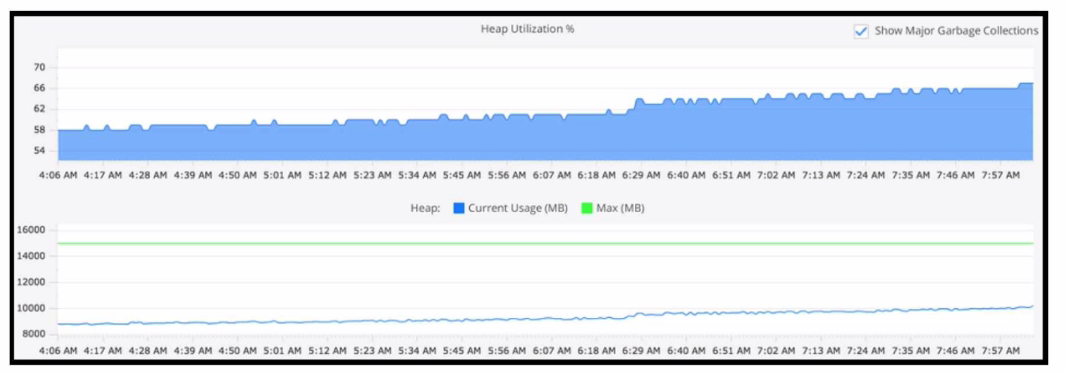
Refer to the exhibit. Using this heap utilization graph, which method is used to confirm if a memory leak is occurring during a certain time frame?
- In metric browser go through Application Infrastructure > Hardware Resources and select Memory Total (MB) and Used (MB)
- Refer to the Tiers and Nodes section and into the Memory tab and visualize Heap Utilization (%) and Heap Current Usage (MB) Vs Max (MB)
- Refer to the Tiers and Nodes section and into the JMX tab and select JVM > Memory > Heap > Max Available (MB) and Current usage (MB)
- In metric browser go through Application Infrastructure > Hardware Resources > Memory Total (MB) and Swap Used (MB)
Correct answer: B
Explanation:
To confirm if a memory leak is occurring, one should refer to the Tiers and Nodes section of the AppDynamics Controller UI, navigate to the Memory tab, and observe the Heap Utilization over time in relation to the Heap's Current Usage (MB) versus the Maximum (MB) allocated. Consistent growth in heap utilization or an upward trend that does not decrement even after garbage collection indicates a potential memory leak. To confirm if a memory leak is occurring, one should refer to the Tiers and Nodes section of the AppDynamics Controller UI, navigate to the Memory tab, and observe the Heap Utilization over time in relation to the Heap's Current Usage (MB) versus the Maximum (MB) allocated. Consistent growth in heap utilization or an upward trend that does not decrement even after garbage collection indicates a potential memory leak.
Question 2
Which two match conditions can be added when you configure an Information Point? (Choose two.)
- Match based on a regex applied to the method
- Match based on the invoked object
- Match based on the Business Transaction
- Match based on the return value
Correct answer: AB
Explanation:
When configuring an Information Point in AppDynamics, you can add match conditions to refine what gets measured. Match conditions based on a regex applied to the method allow you to specify which methods to include based on a regular expression pattern. Matching based on the invoked object allows you to specify which objects' methods are included, filtering the data according to the object type or instance. These conditions help in pinpointing specific methods or objects for which you want to collect runtime information.Reference: AppDynamics documentation on Information Points and Match Conditions. When configuring an Information Point in AppDynamics, you can add match conditions to refine what gets measured. Match conditions based on a regex applied to the method allow you to specify which methods to include based on a regular expression pattern. Matching based on the invoked object allows you to specify which objects' methods are included, filtering the data according to the object type or instance. These conditions help in pinpointing specific methods or objects for which you want to collect runtime information.
Reference: AppDynamics documentation on Information Points and Match Conditions.
Question 3
What are two examples of backend calls? (Choose two.)
- a request coming from a browser
- a tier-to-tier request
- an asynchronous request
- a remote services call
Correct answer: BD
Explanation:
Backend calls in AppDynamics are the interactions that an application component has with external components or services. These can include calls to databases, remote service calls, and interactions between different tiers of an application.A tier-to-tier request refers to any internal call that happens between different tiers (or nodes) within the same application. For example, a web tier calling an API service tier within the same application ecosystem.A remote services call is an external call from an application to a service that resides outside of the application's environment, like a call to an external web service, REST API, or a third-party service provider.AppDynamics documentation on Backend Detection: https://docs.appdynamics.com/21.6/en/application-monitoring/identify-backends Backend calls in AppDynamics are the interactions that an application component has with external components or services. These can include calls to databases, remote service calls, and interactions between different tiers of an application.
A tier-to-tier request refers to any internal call that happens between different tiers (or nodes) within the same application. For example, a web tier calling an API service tier within the same application ecosystem.
A remote services call is an external call from an application to a service that resides outside of the application's environment, like a call to an external web service, REST API, or a third-party service provider.
AppDynamics documentation on Backend Detection: https://docs.appdynamics.com/21.6/en/application-monitoring/identify-backends
Question 4
Which three reports can be scheduled for periodic generation and delivery to email recipients? (Choose three.)
- Ad Hoc Data
- Application Health
- Error Trends
- Custom Dashboard
- Controller Audit
- Tier List
Correct answer: BCD
Explanation:
AppDynamics allows for several reports to be scheduled for periodic generation and sent to email recipients. Among these, Application Health, Error Trends, and Custom Dashboards are types of reports that can be automatically generated and delivered, providing regular insights into the application's performance and issues.AppDynamics documentation on Reports: https://docs.appdynamics.com/latest/en/application-monitoring/reporting AppDynamics allows for several reports to be scheduled for periodic generation and sent to email recipients. Among these, Application Health, Error Trends, and Custom Dashboards are types of reports that can be automatically generated and delivered, providing regular insights into the application's performance and issues.
AppDynamics documentation on Reports: https://docs.appdynamics.com/latest/en/application-monitoring/reporting
Question 5
A Performance Analyst is experiencing difficulty with the transaction response time on a node. The Performance Analyst attempts to create a health rule monitoring the business transactions' performance on that node.
Which set of data should the Performance Analyst select when creating the health rule?
- Node health
- Service endpoints
- Error Rates
- Transaction performance
Correct answer: D
Explanation:
When a Performance Analyst is faced with issues related to transaction response times on a specific node, focusing on the 'Transaction performance' data is most relevant. This is because transaction performance metrics provide direct insights into the business transactions' speed, response times, and execution times, which are critical for identifying and troubleshooting performance issues. By selecting 'Transaction performance' when creating a health rule, the analyst can monitor specific metrics such as average response time, slow transaction count, and very slow transaction count, which are directly related to the performance of business transactions on the node in question.AppDynamics documentation on Health Rules: This section explains how to create and configure health rules to monitor application performance metrics, including transaction performance.AppDynamics documentation on Business Transactions: Provides details on how AppDynamics identifies and monitors business transactions, which are key to understanding application performance. When a Performance Analyst is faced with issues related to transaction response times on a specific node, focusing on the 'Transaction performance' data is most relevant. This is because transaction performance metrics provide direct insights into the business transactions' speed, response times, and execution times, which are critical for identifying and troubleshooting performance issues. By selecting 'Transaction performance' when creating a health rule, the analyst can monitor specific metrics such as average response time, slow transaction count, and very slow transaction count, which are directly related to the performance of business transactions on the node in question.
AppDynamics documentation on Health Rules: This section explains how to create and configure health rules to monitor application performance metrics, including transaction performance.
AppDynamics documentation on Business Transactions: Provides details on how AppDynamics identifies and monitors business transactions, which are key to understanding application performance.
Question 6
Developers and operations personnel complain the Controller tracks many irrelevant Java classes and methods. How does a Performance Analyst exclude this unhelpful information?
- Configuration > Baselines and create a new dynamic baseline
- Edit the mbeans-server.xml file to delete the irrelevant methods
- Configuration > Instrumentation > Call Graph Settings and exclude irrelevant packages
- Edit the controller-info.xml file to exclude irrelevant methods
Correct answer: C
Explanation:
To streamline the monitoring process and enhance the relevance of collected data, AppDynamics allows Performance Analysts to exclude certain Java classes and methods from instrumentation. This is done through the 'Configuration > Instrumentation > Call Graph Settings' menu, where irrelevant packages and classes can be specified for exclusion. This approach prevents the AppDynamics agent from tracking unnecessary or irrelevant methods, thus reducing overhead and focusing on the most critical aspects of application performance.AppDynamics documentation on Call Graph Settings: This section details how to configure call graph settings, including the exclusion of specific classes and methods from instrumentation, to optimize performance monitoring. To streamline the monitoring process and enhance the relevance of collected data, AppDynamics allows Performance Analysts to exclude certain Java classes and methods from instrumentation. This is done through the 'Configuration > Instrumentation > Call Graph Settings' menu, where irrelevant packages and classes can be specified for exclusion. This approach prevents the AppDynamics agent from tracking unnecessary or irrelevant methods, thus reducing overhead and focusing on the most critical aspects of application performance.
AppDynamics documentation on Call Graph Settings: This section details how to configure call graph settings, including the exclusion of specific classes and methods from instrumentation, to optimize performance monitoring.
Question 7
Which three pieces of information are required when creating a new database collector? (Choose three.)
- Primary table name
- Database hostname/IP address
- System table name
- Database Type
- Port number
Correct answer: BD
Explanation:
When creating a new database collector in AppDynamics, the essential pieces of information required include the 'Database hostname/IP address,' 'Database Type,' and 'Port number.' These details are crucial for establishing a connection to the database and ensuring accurate monitoring. The hostname/IP address identifies the server where the database is hosted, the Database Type specifies the database management system (e.g., MySQL, Oracle), and the Port number is necessary for network communication with the database server.AppDynamics documentation on Database Visibility: This section explains how to set up database collectors, including the required information for successful configuration. When creating a new database collector in AppDynamics, the essential pieces of information required include the 'Database hostname/IP address,' 'Database Type,' and 'Port number.' These details are crucial for establishing a connection to the database and ensuring accurate monitoring. The hostname/IP address identifies the server where the database is hosted, the Database Type specifies the database management system (e.g., MySQL, Oracle), and the Port number is necessary for network communication with the database server.
AppDynamics documentation on Database Visibility: This section explains how to set up database collectors, including the required information for successful configuration.
Question 8
Which two Key Performance Indicators (KPIs) accurately provide insight into server level resource consumption? (Choose two.)
- Calls per Minute
- Availability
- Average Response Time
- Application Restarts
- CPU %Busy
- Memory Used%
Correct answer: EF
Explanation:
Key Performance Indicators (KPIs) such as 'CPU %Busy' and 'Memory Used%' are critical for providing insights into server-level resource consumption. 'CPU %Busy' indicates the percentage of time the CPU is actively working on processes, reflecting the server's processing workload. 'Memory Used%' shows the proportion of memory utilized, indicating how much of the server's RAM is being consumed by applications and processes. These KPIs are essential for understanding and managing server performance and resource allocation.AppDynamics documentation on Server Monitoring: Includes information on monitoring server-level metrics, including CPU and memory utilization, to assess resource consumption. Key Performance Indicators (KPIs) such as 'CPU %Busy' and 'Memory Used%' are critical for providing insights into server-level resource consumption. 'CPU %Busy' indicates the percentage of time the CPU is actively working on processes, reflecting the server's processing workload. 'Memory Used%' shows the proportion of memory utilized, indicating how much of the server's RAM is being consumed by applications and processes. These KPIs are essential for understanding and managing server performance and resource allocation.
AppDynamics documentation on Server Monitoring: Includes information on monitoring server-level metrics, including CPU and memory utilization, to assess resource consumption.
Question 9
What are two options tor sharing snapshot details from the snapshot window? (Choose two.)
- Custom Report
- Custom Dashboard
- Download PDF
- Copy to Clipboard
- Export
Correct answer: CE
Explanation:
To share snapshot details from the snapshot window in AppDynamics, the options to 'Download PDF' and 'Export' are typically used. 'Download PDF' allows users to generate a PDF report of the snapshot details, providing a convenient and portable format for sharing and review. The 'Export' option enables the extraction of snapshot data in various formats (e.g., CSV, XML), facilitating further analysis or sharing with other tools and stakeholders.AppDynamics documentation on Snapshots: This section covers how snapshots capture detailed performance data for transactions, including how to share and export this information for collaborative analysis. To share snapshot details from the snapshot window in AppDynamics, the options to 'Download PDF' and 'Export' are typically used. 'Download PDF' allows users to generate a PDF report of the snapshot details, providing a convenient and portable format for sharing and review. The 'Export' option enables the extraction of snapshot data in various formats (e.g., CSV, XML), facilitating further analysis or sharing with other tools and stakeholders.
AppDynamics documentation on Snapshots: This section covers how snapshots capture detailed performance data for transactions, including how to share and export this information for collaborative analysis.
Question 10
A Performance Analyst notices an increase in Business Transaction error rate that is much higher than normal alerts. The Performance Analyst can see these are related to the Health Rules defined for the Shopping Service that is monitored with AppDynamics Browser RUM. While troubleshooting the Performance Analyst wants details on which Browsers and Devices are affected. Which section of the Browser App Dashboard will provide this detail for a given time period?
- Usage Stats
- Sessions
- Pages & Ajax Requests
- Overview
Correct answer: A
Explanation:
In the Browser Real User Monitoring (RUM) Dashboard, the Usage Stats section provides insights into user demographics, including the types of browsers and devices they are using. This section would help the Performance Analyst understand which browsers and devices are affected during a specific time period when there has been an increase in the Business Transaction error rate.AppDynamics documentation on Browser RUM: https://docs.appdynamics.com/21.6/en/end-user-monitoring/browser-monitoring/browser-real-user-monitoring In the Browser Real User Monitoring (RUM) Dashboard, the Usage Stats section provides insights into user demographics, including the types of browsers and devices they are using. This section would help the Performance Analyst understand which browsers and devices are affected during a specific time period when there has been an increase in the Business Transaction error rate.
AppDynamics documentation on Browser RUM: https://docs.appdynamics.com/21.6/en/end-user-monitoring/browser-monitoring/browser-real-user-monitoring
HOW TO OPEN VCE FILES
Use VCE Exam Simulator to open VCE files
HOW TO OPEN VCEX AND EXAM FILES
Use ProfExam Simulator to open VCEX and EXAM files
ProfExam at a 20% markdown
You have the opportunity to purchase ProfExam at a 20% reduced price
Get Now!